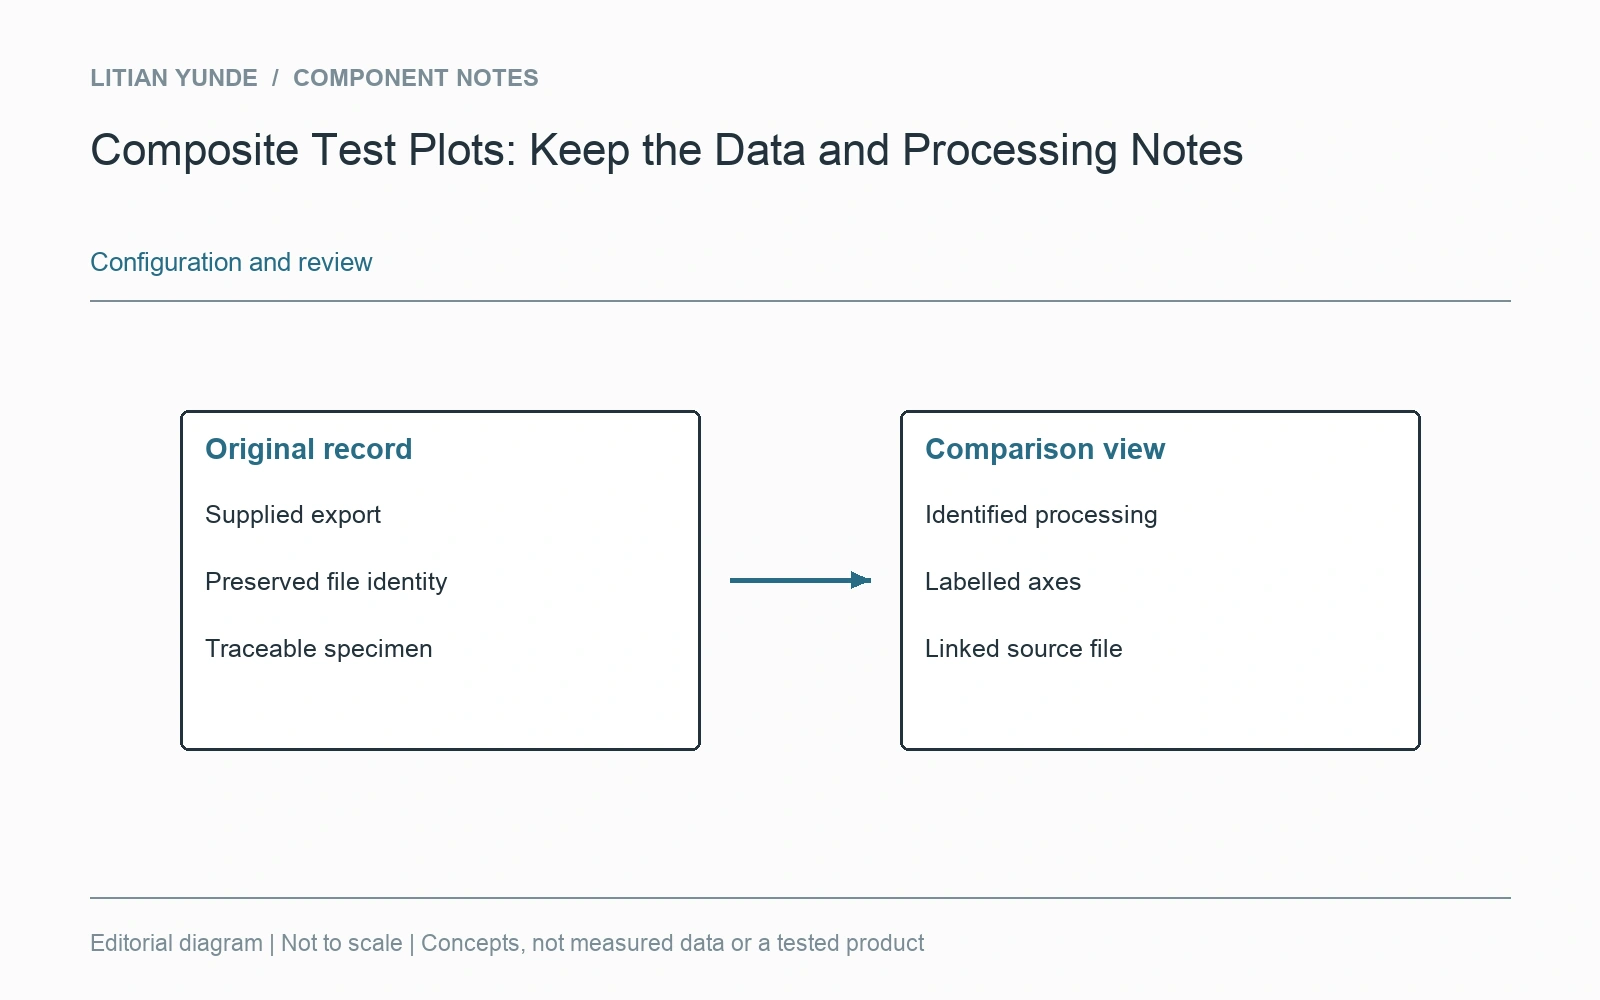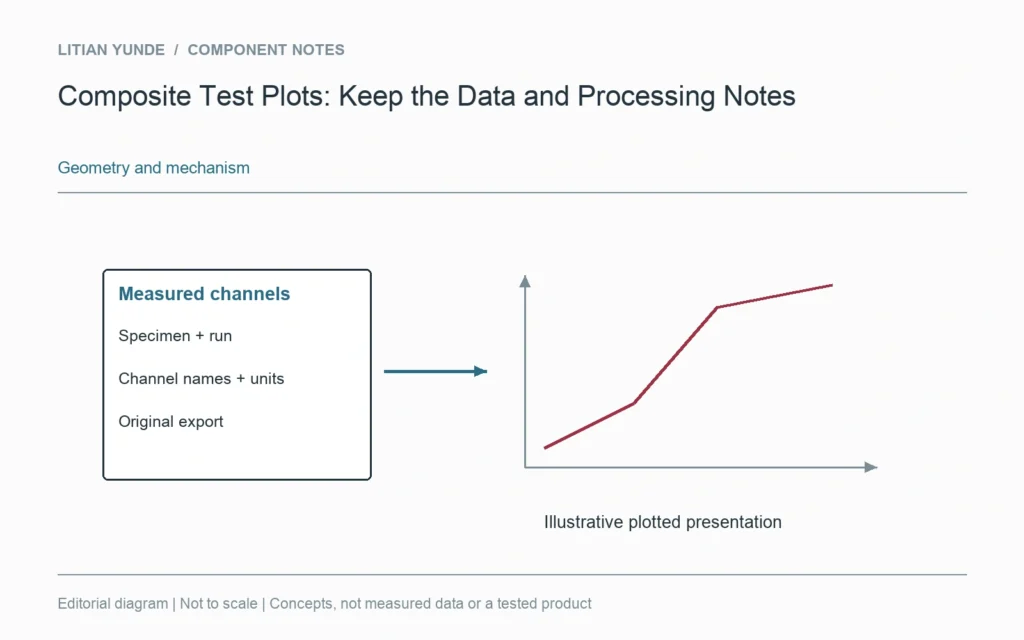
A plotted curve is a presentation of data. If a composite test record must support later review, agree which data file and processing notes accompany the plot. A screenshot with an unlabelled axis is difficult to trace, compare or reproduce.
Retain the connection to the specimen
The plot, data export and report should identify the same specimen and test run. Keep channel names and units in the export. If the laboratory supplies several specimens in one file, retain a clear mapping rather than relying on the order of curves in a screenshot.
Explain changes made to the presentation
A report can include zero adjustment, filtering, smoothing, excluded points or calculated channels. Ask the laboratory to describe the operations relevant to the agreed result. Preserve the supplied original separately from a customer-created comparison chart. Do not redraw a measured curve as an editorial illustration and present it as the original evidence.
Agree the deliverable before testing
Specify whether the order needs a signed report, a machine-readable export, setup information or a particular calculated result. Those are different deliverables and may need different preparation. When an unusual feature appears on a curve, use the traceable data and setup record for the review instead of inferring its cause from a compressed image. A well-labelled chart helps communication, but it is not a replacement for the agreed source record.